For years, Tibia players have traded characters based on intuition.
“Feels like Knights are going up.”
“Druids seem cheaper lately.”
“After the update, prices exploded.”
“Druids seem cheaper lately.”
“After the update, prices exploded.”
But now?
You don’t have to guess anymore.
Exiva Pro Insights is live — and it completely changes how you understand the Tibia Character Bazaar.
This is not just data.
This is market intelligence.
This is market intelligence.
Let’s break down what each section does — and how it helps you in real life.
Overview Dashboard — Understanding the Market Pulse
The Overview page shows the health and activity of the entire Tibia auction market in real time.
Think of it as your market heartbeat.
▶️ New Auctions by Day
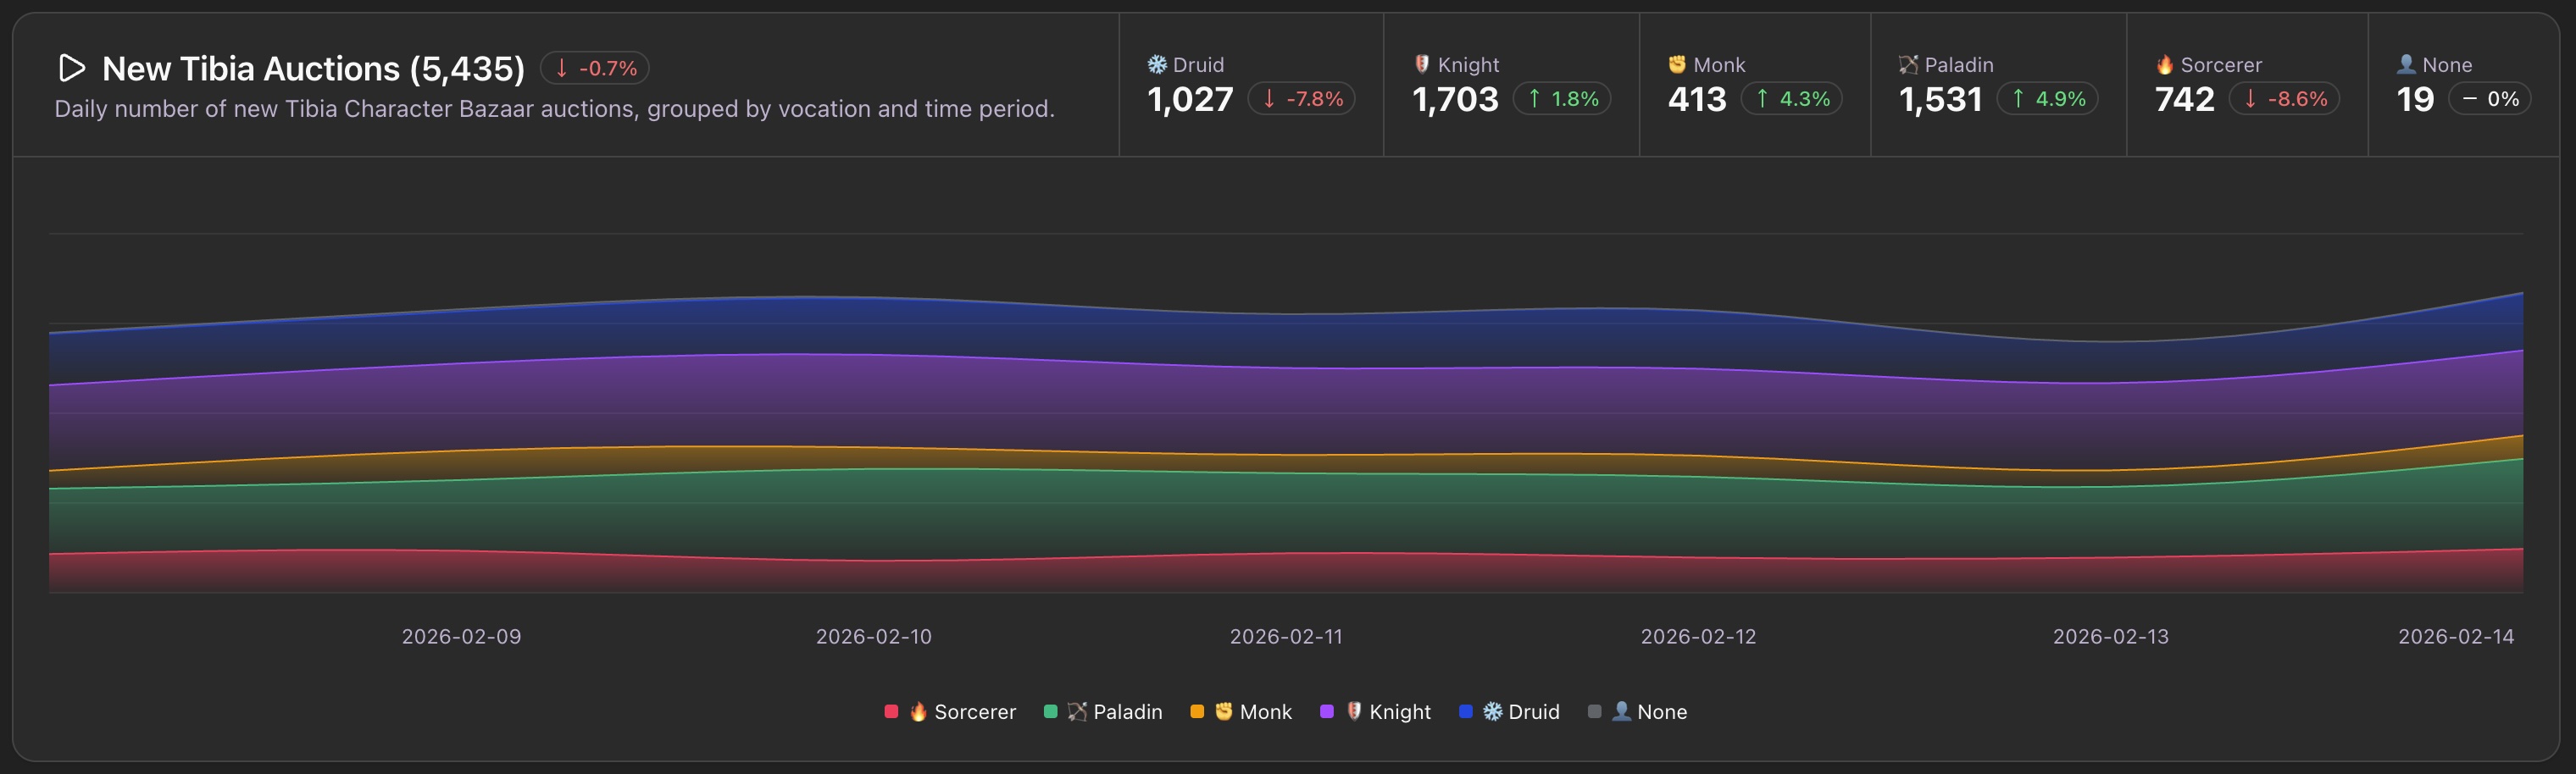
Question this chart answers:
👉 Is supply increasing or drying up?
👉 Is supply increasing or drying up?
This chart shows how many characters are entering the market each day, split by vocation.
Why this matters
- If supply spikes → prices may drop
- If supply drops → competition increases
- If one vocation suddenly surges → something is happening
You can:
- Track seasonal patterns
- Compare vocation popularity
- Spot unusual spikes before others do
Major game updates are marked directly on the timeline, so you can see how the market reacted.
No guessing.
⏰ Ended Auctions by Day
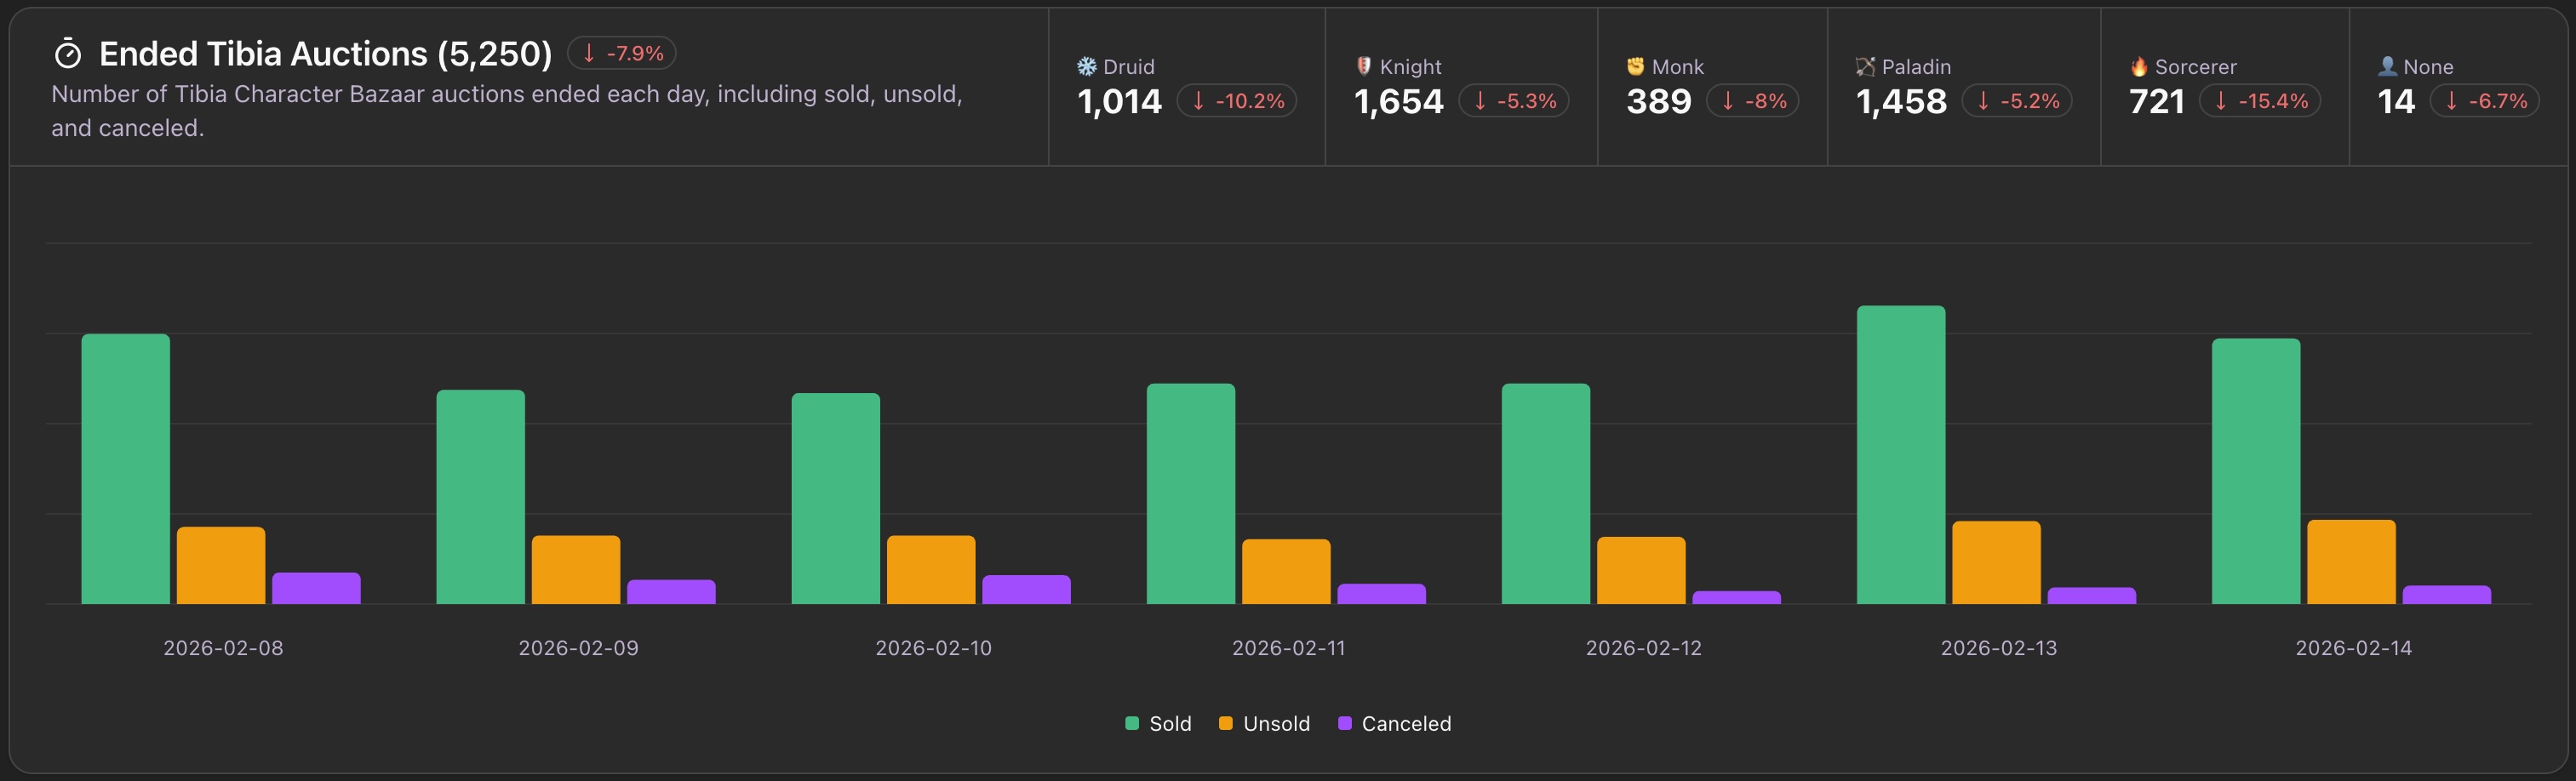
Question this chart answers:
👉 Is the market actually buying — or just listing?
👉 Is the market actually buying — or just listing?
This stacked bar chart shows:
- Sold
- Unsold
- Canceled
Why it matters
- High “Sold” ratio = strong demand
- Many “Unsold” = overpriced listings or weak market
- After updates → you can measure confidence instantly
If you’re about to list a character, this chart tells you whether it’s a good moment.
💰 Coins Processed by Day
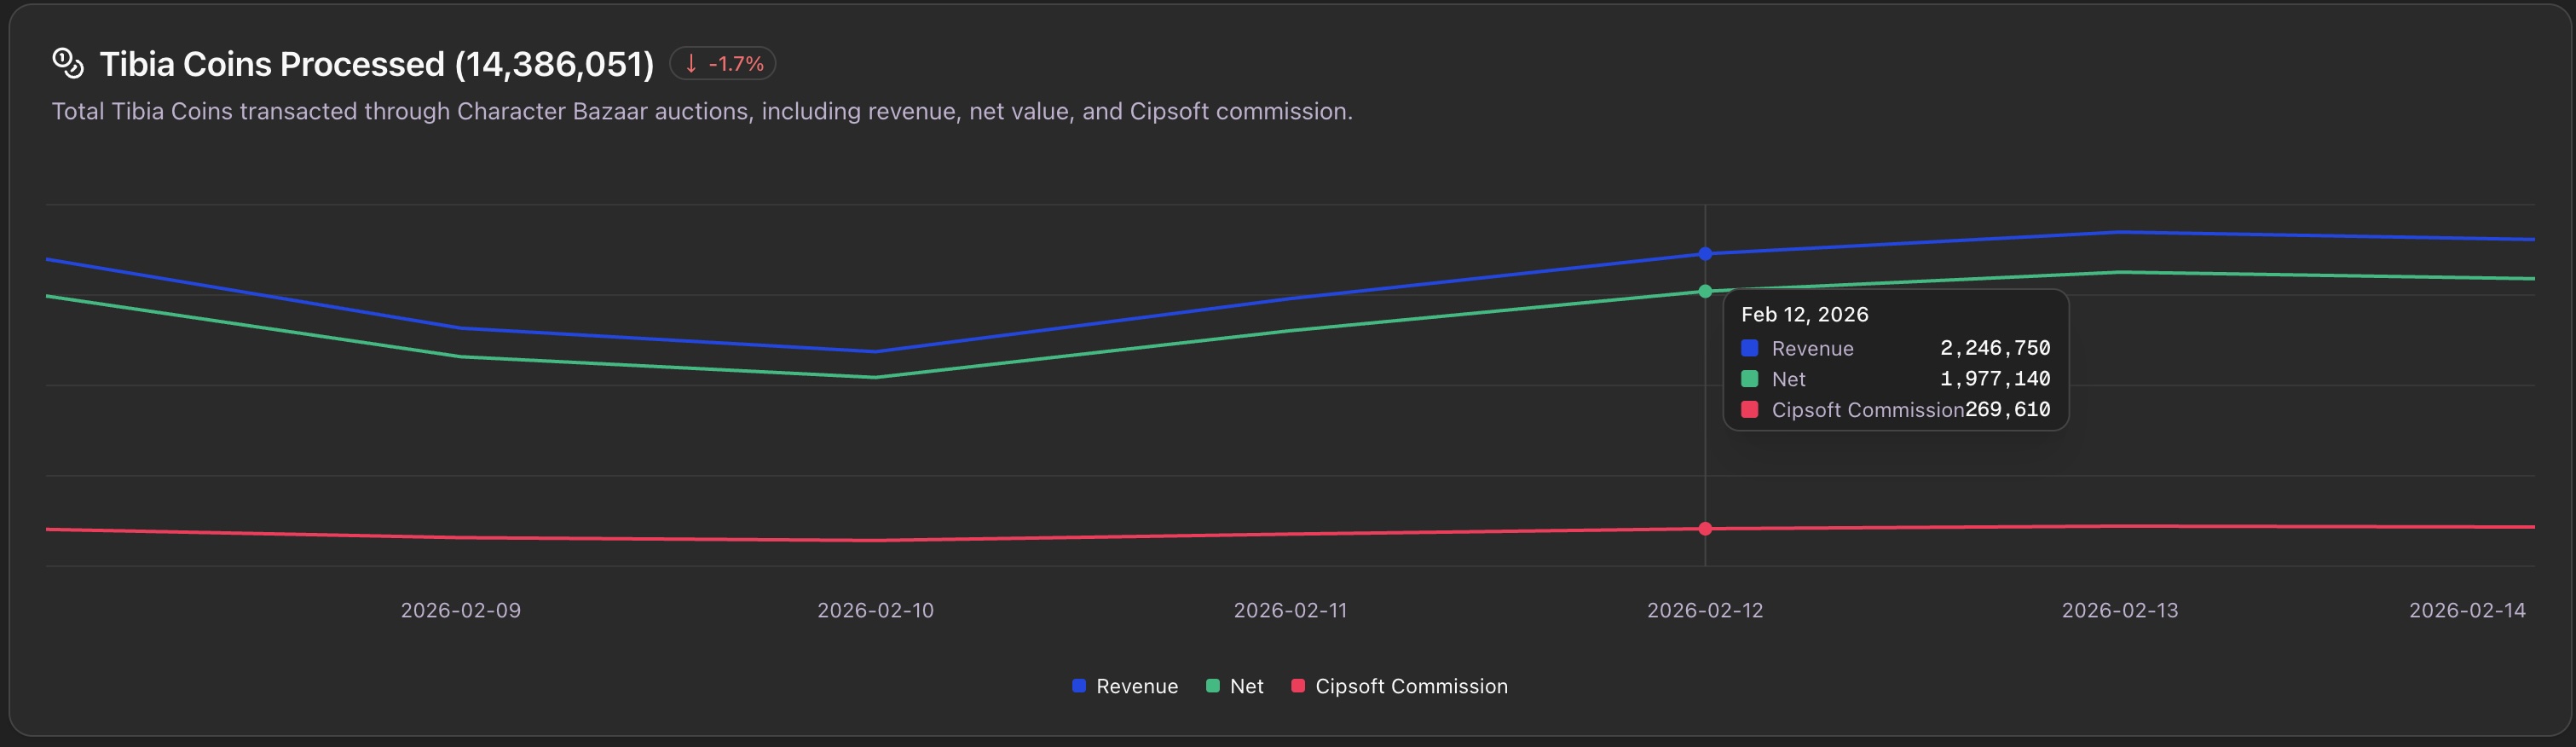
Question this chart answers:
👉 How much money is really moving in the market?
👉 How much money is really moving in the market?
This shows total Tibia Coins transacted daily.
It reveals:
- Market growth or contraction
- Spending waves
- Post-update surges
- Community activity cycles
More coins processed = higher liquidity = easier sales.
Simple as that.
💎 Top Transactions by Day
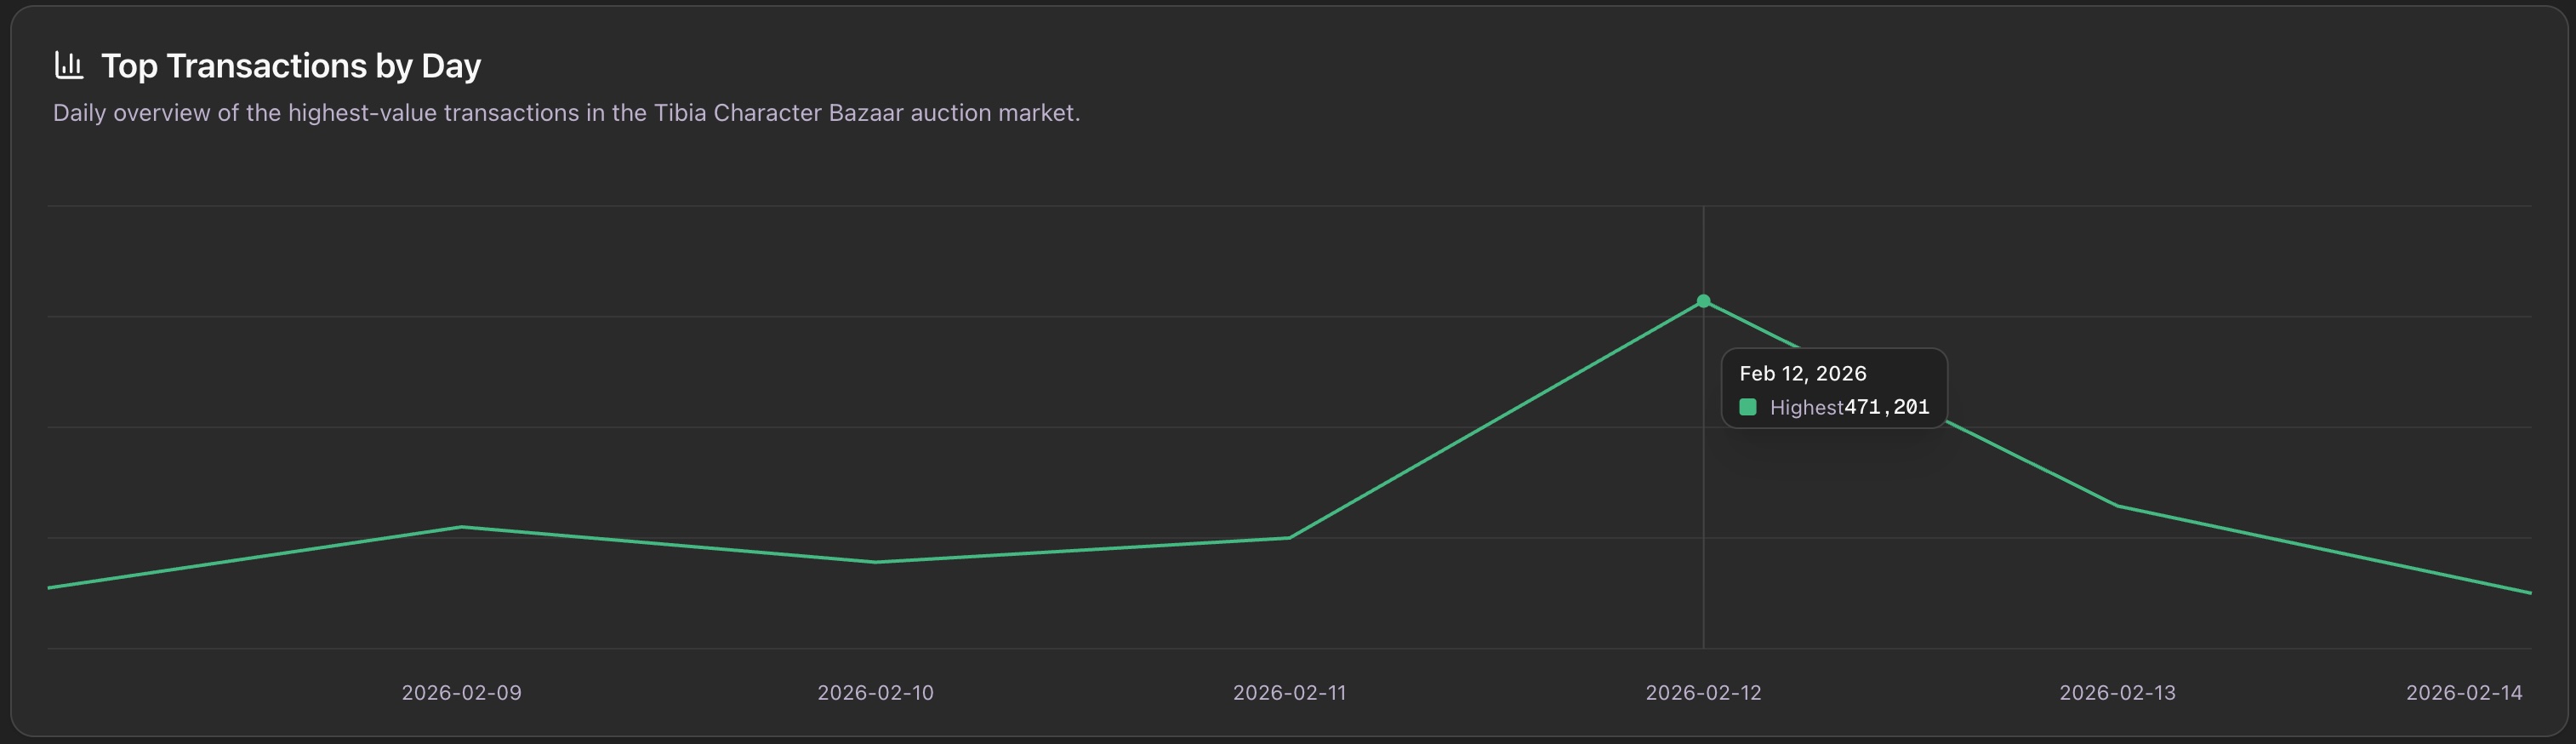
Question this chart answers:
👉 How extreme is the market right now?
👉 How extreme is the market right now?
This chart tracks the highest transaction per day.
It helps you:
- Understand premium ceilings
- Spot bargain periods
- Measure price dispersion
- Detect unusual outliers
📈 Pricing Insights — Where Strategy Begins
Now we get serious.
This is where traders start smiling.
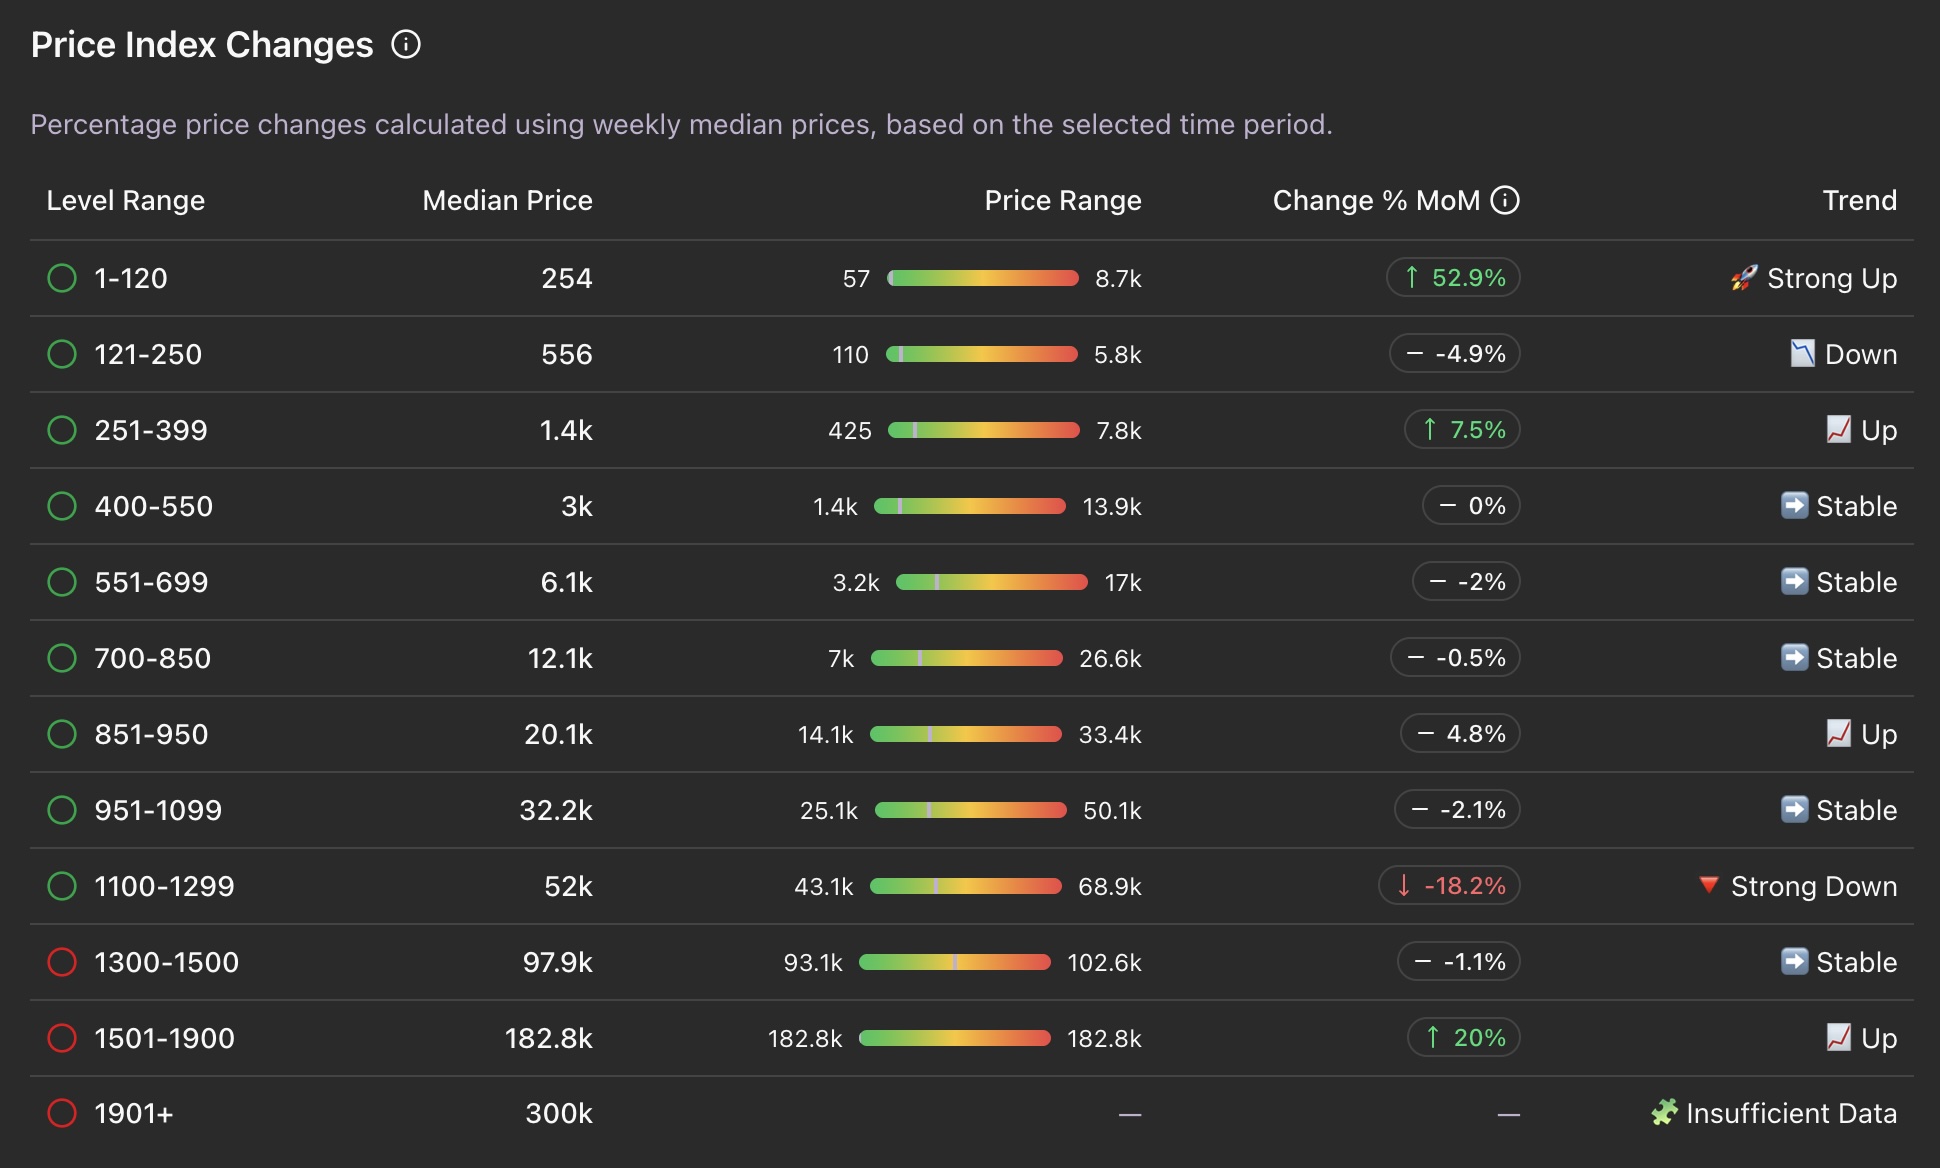
📊 Weekly Price Index
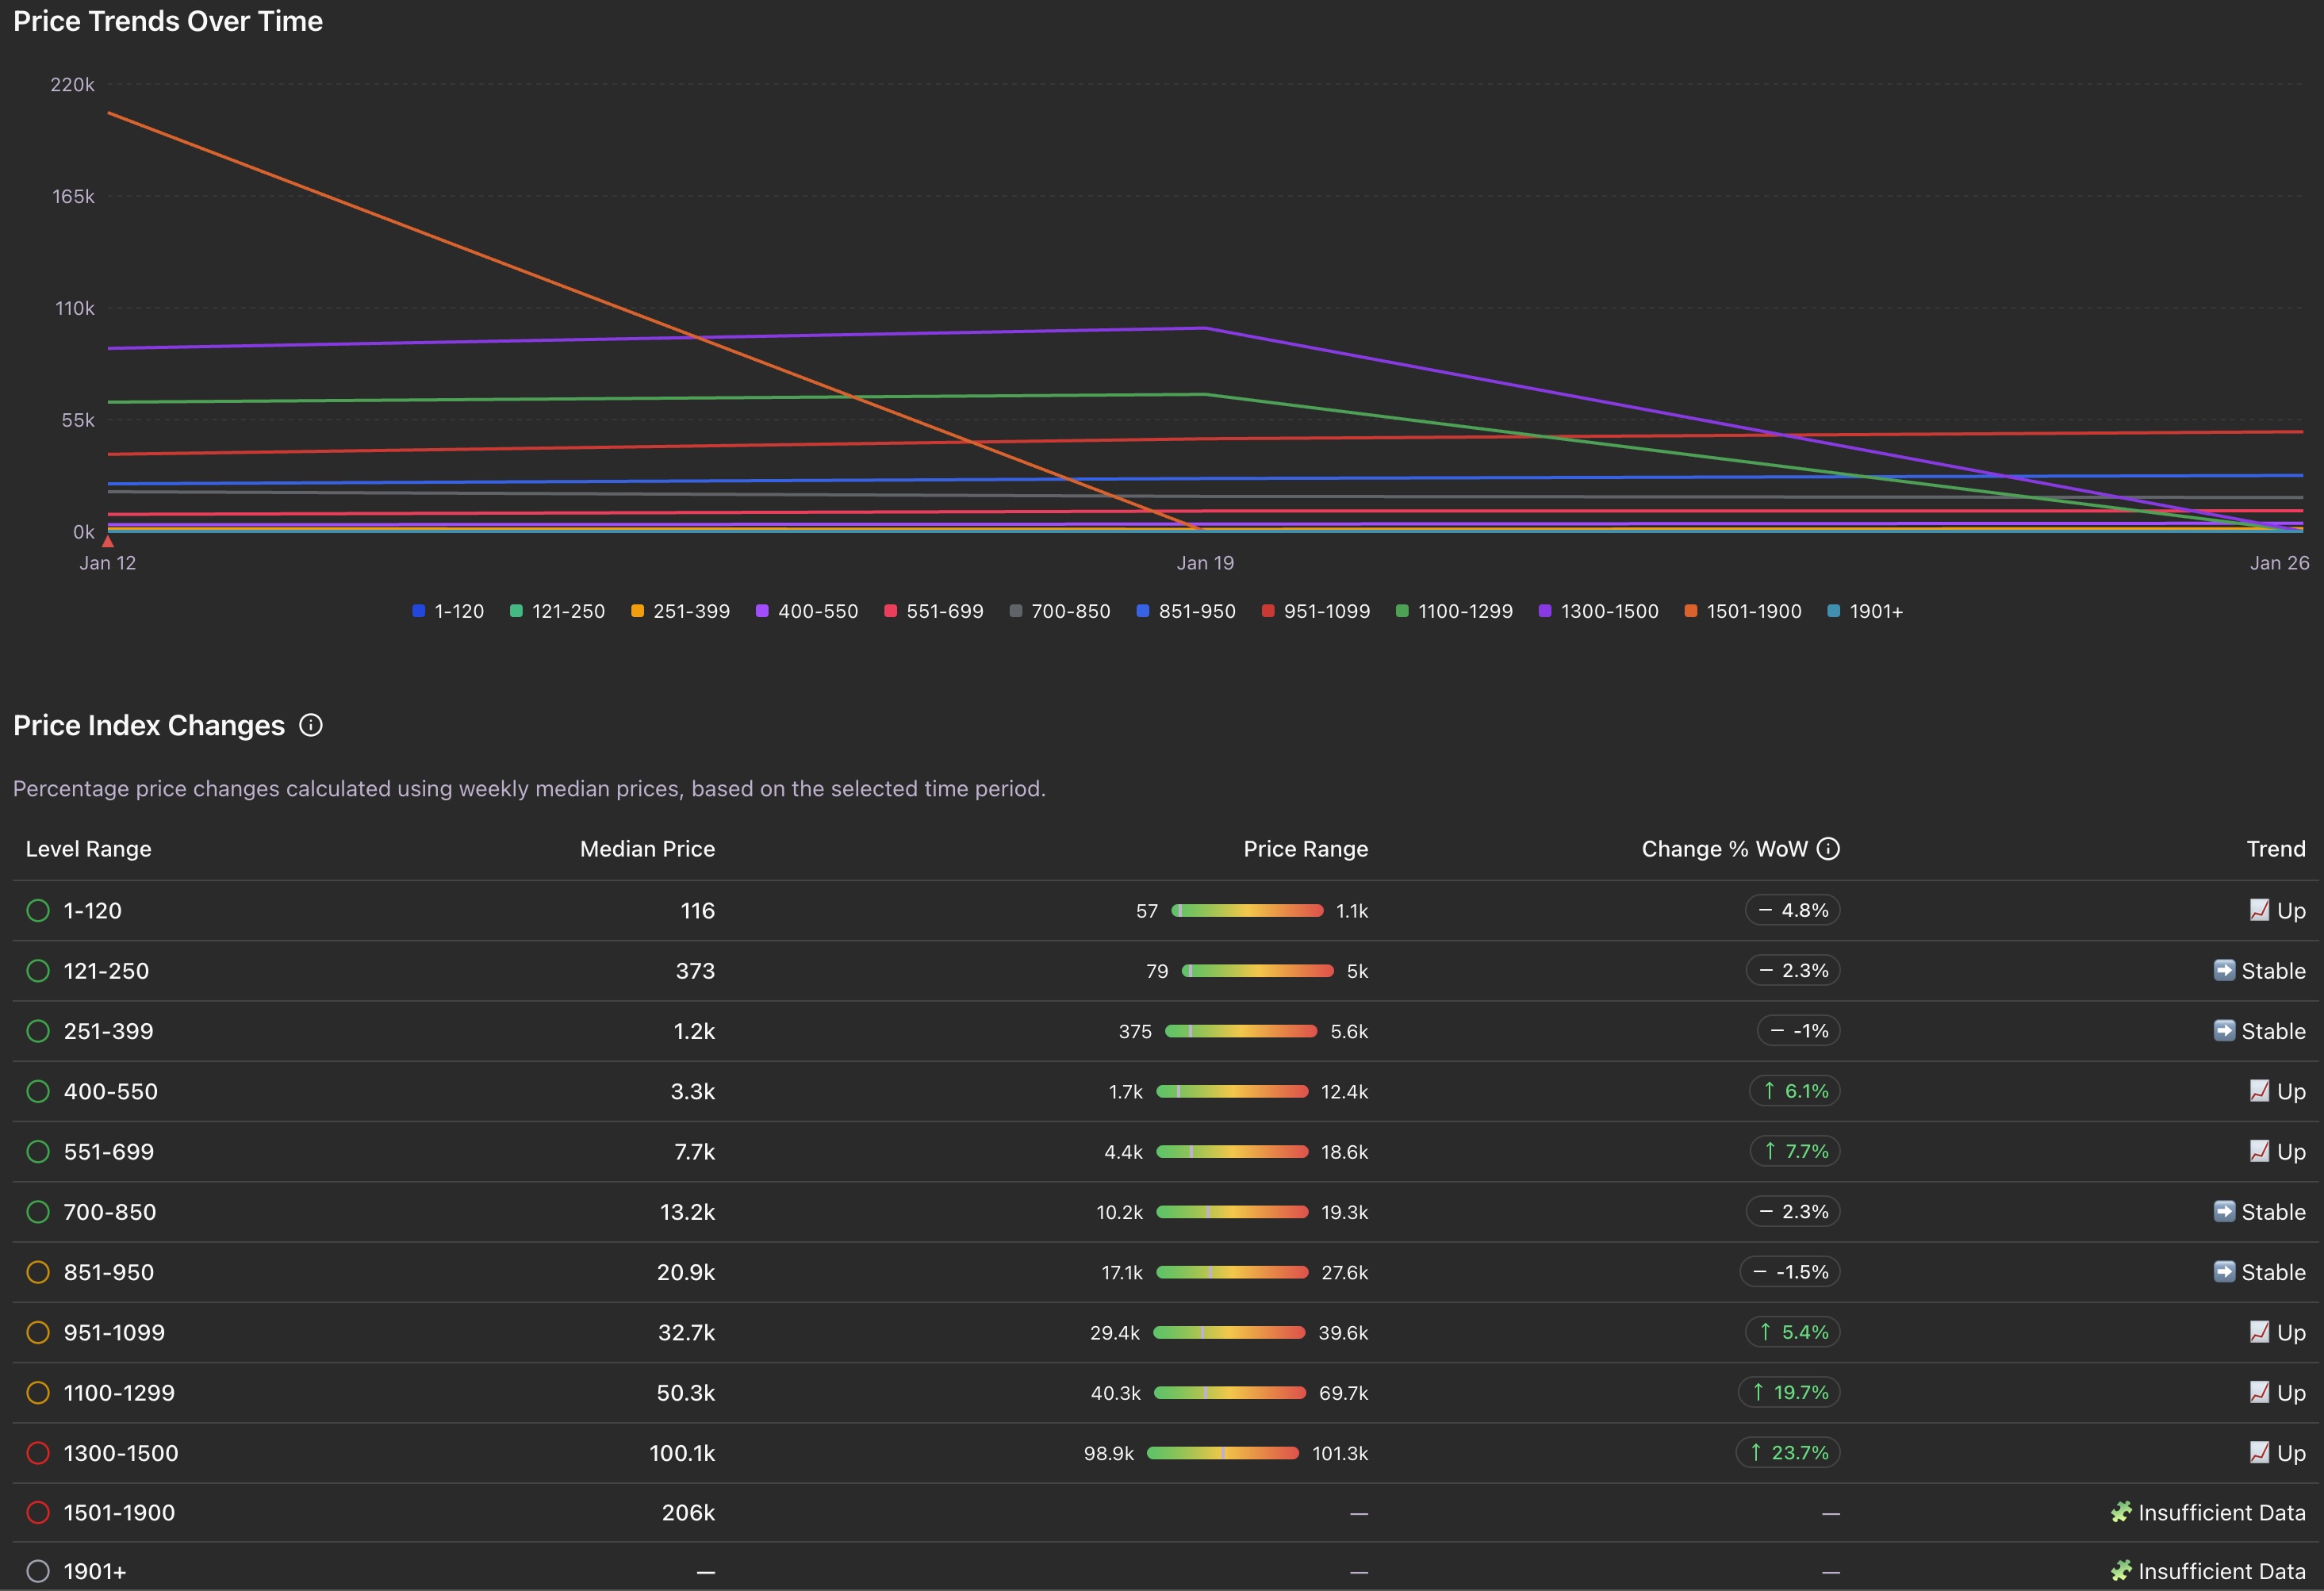
Question this chart answers:
👉 Are prices actually going up — or just fluctuating?
👉 Are prices actually going up — or just fluctuating?
Instead of raw prices, this index tracks weekly median values by level range.
Why weekly?
Because daily data is noisy. Weekly aggregation shows real trends.
Because daily data is noisy. Weekly aggregation shows real trends.
You can filter by:
- Vocation
- PvP type
- BattlEye status
This lets you see:
- Which level brackets are appreciating
- Which are losing value
- Where momentum is building
- How updates affect different segments
This is your stock chart for Tibia characters.
🚀 Price Momentum
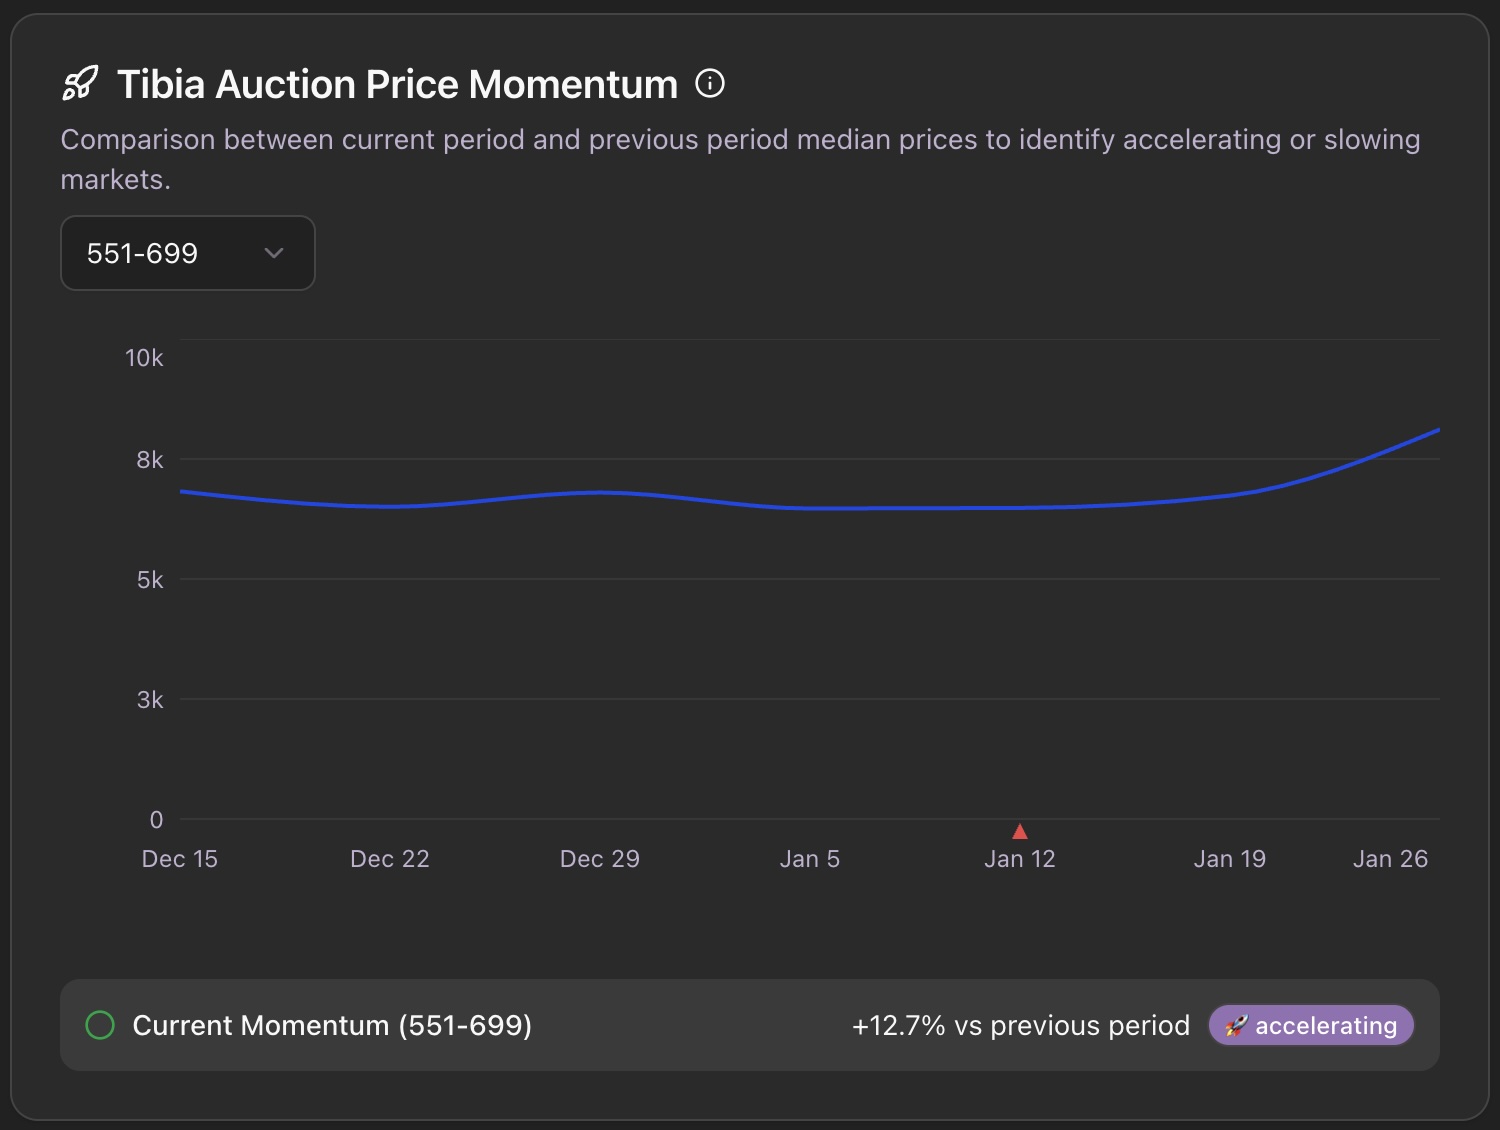
Question this chart answers:
👉 Is the trend accelerating or slowing down?
👉 Is the trend accelerating or slowing down?
Momentum compares current period median vs previous period.
This tells you:
- If growth is picking up
- If prices are losing strength
- If a reversal may be forming
Momentum often moves before price fully adjusts.
If you understand this chart, you’re ahead of the market.
🧠 Market Sentiment
Question this answers:
👉 Is the market confident right now?
👉 Is the market confident right now?
By combining:
- Success rates
- Volume
- Price changes
You get a snapshot of market mood:
- Bullish
- Bearish
- Stable
Perfect for timing entries and exits.
🗓 Major Game Updates — Context Matters
At the bottom of the page, you’ll see major Tibia updates and balance changes that may have influenced the market.
Because prices don’t move randomly:
- Summer updates
- Winter updates
- Vocation balancing
Now you can visually connect:
Update → Market reaction → Trend shift
That’s powerful.
🧩 Why This Changes Everything
Before Insights:
- You relied on intuition
- You relied on Discord opinions
- You relied on “feeling”
Now:
- You have real aggregated market data
- You have weekly index tracking
- You have momentum signals
- You have update markers
- You have liquidity indicators
This is the most complete view of the Tibia Character Bazaar ever built.
🎯 Who Benefits Most?
🧠 Traders
Time entries and exits based on real data.
💎 Collectors
Track long-term value appreciation.
⚔️ Players
Sell when demand is strong — not when it “feels right.”
🏰 Guild Leaders
Plan character acquisitions based on market cycles.
🏁 Final Thoughts
Tibia has always had an economy.
Now it has analytics.
Exiva Pro Insights turns raw auction data into something actionable.
If you care about:
- Value
- Timing
- Market trends
- Strategic trading
This page was built for you.
And we’re just getting started. 🚀